
The dew point is a critical meteorological measurement that helps determine air moisture levels. It represents the temperature at which air becomes saturated with water vapor, leading to condensation. The dew point chart is a valuable tool used in weather forecasting, HVAC systems, and industrial applications to assess humidity and predict potential condensation issues.
In this article, we will explore the dew point chart, its significance, and how to interpret it effectively.
What is a Dew Point Chart?
A dew point chart is a reference table or graph that displays the relationship between temperature, relative humidity, and the dew point temperature. It allows users to determine the dew point by matching air temperature with a given percentage of relative humidity.
These charts are particularly useful in industries like meteorology, agriculture, and HVAC, where controlling moisture levels is crucial.
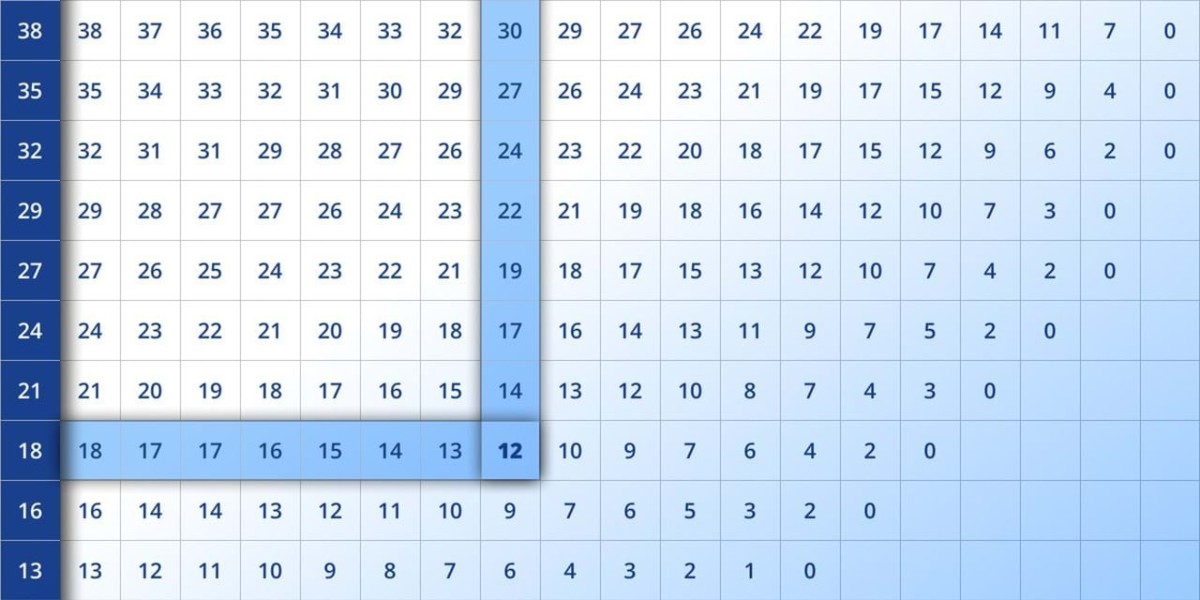
How to Read a Dew Point Chart
A dew point chart consists of three main elements:
Air Temperature (°C or °F) – The ambient air temperature, usually displayed in rows.
Relative Humidity (%) – The moisture content in the air, usually displayed in columns.
Dew Point (°C or °F) – The temperature at which moisture in the air will condense.
To use a dew point chart, follow these steps:
Locate the current air temperature in the chart.
Identify the corresponding relative humidity value.
Find the intersection of these two values, which gives the dew point temperature.
For example, if the air temperature is 80°F and the relative humidity is 60%, the dew point temperature would be approximately 65°F.
The Importance of Dew Point in Weather Forecasting
Meteorologists rely on the dew point to assess air moisture levels and predict weather conditions. The higher the dew point, the more humid the air feels. Conversely, a low dew point indicates dry air.
Dew Point Above 65°F: High humidity levels, often leading to discomfort and a higher chance of rain or storms.
Dew Point Below 40°F: Dry air, which can lead to respiratory irritation and static electricity.
Dew Point Below Freezing (32°F): Can lead to frost formation and hazardous driving conditions.
By monitoring the dew point, weather experts can predict fog, dew, and even the likelihood of thunderstorms.
Applications of Dew Point Charts in Different Industries
HVAC Systems
In heating, ventilation, and air conditioning (HVAC) systems, dew point charts help technicians prevent condensation in ducts and ensure optimal indoor air quality.
Agriculture
Farmers use dew point data to protect crops from excessive moisture, which can lead to fungal growth and disease. Greenhouses also rely on dew point monitoring to maintain proper humidity levels.
Industrial Processes
Manufacturing industries, such as pharmaceuticals and food processing, use dew point charts to prevent moisture-related issues in production and storage.
Aviation
Pilots use dew point information to assess visibility conditions and predict fog formation, which can impact flight safety.
Dew Point vs. Relative Humidity
Many people confuse dew point with relative humidity, but they are different:
Relative Humidity (%): Measures the amount of moisture in the air compared to the maximum it can hold at a specific temperature.
Dew Point (°F or °C): The absolute measure of moisture in the air, independent of temperature.
A high relative humidity at cold temperatures does not always indicate high moisture content, whereas a high dew point always signifies a significant amount of water vapor in the air.
How to Use a Dew Point Chart to Prevent Condensation Issues
Condensation occurs when the dew point temperature is equal to or higher than the surface temperature. To avoid condensation problems:
Keep indoor surfaces warmer than the dew point.
Use dehumidifiers to lower humidity.
Increase air circulation to reduce localized condensation.
By referring to a dew point chart, building engineers and homeowners can maintain indoor environments that prevent mold growth and structural damage.
Conclusion
A dew point chart is a valuable tool for understanding moisture levels in the air and predicting condensation. Whether used in weather forecasting, HVAC, agriculture, or industrial settings, knowing how to interpret a dew point chart can help in making informed decisions about air quality and comfort.
By using dew point data effectively, you can optimize indoor environments, improve personal comfort, and prevent moisture-related issues. Keep an eye on the dew point—it’s more than just a weather term; it’s a key factor in understanding humidity and air conditions.